IOOS Hurricane Glider Coordination

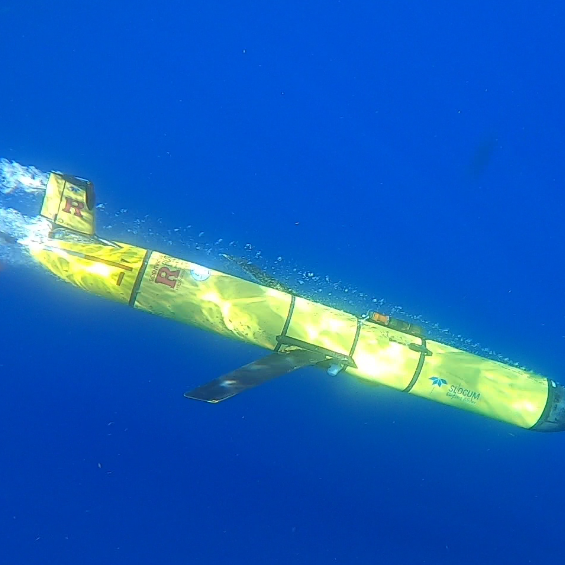
Underwater gliders provide critical subsurface ocean data to improve hurricane intensity forecasts and protect lives along U.S. coasts.

Navigation

Why Hurricane Forecasting Matters

Tropical cyclones are one of the costliest and deadliest natural hazards affecting the U.S. While NOAA has significantly improved hurricane track forecasts over the last few decades, intensity forecast improvements have lagged in comparison. Warm ocean waters provide the fuel for tropical cyclones and can have a major impact on their intensity.

Unexpected rapid intensification of tropical cyclones in the hours before landfall can catch coastal communities off guard with deadly consequences, while unexpected rapid weakening can erode public trust in forecasts and evacuation guidance, and can lead to costly and unnecessary evacuations.

Local governments and decision-makers need accurate hurricane forecasts to make cost-effective preparation and evacuation decisions that impact human life and property.

Critical Insight

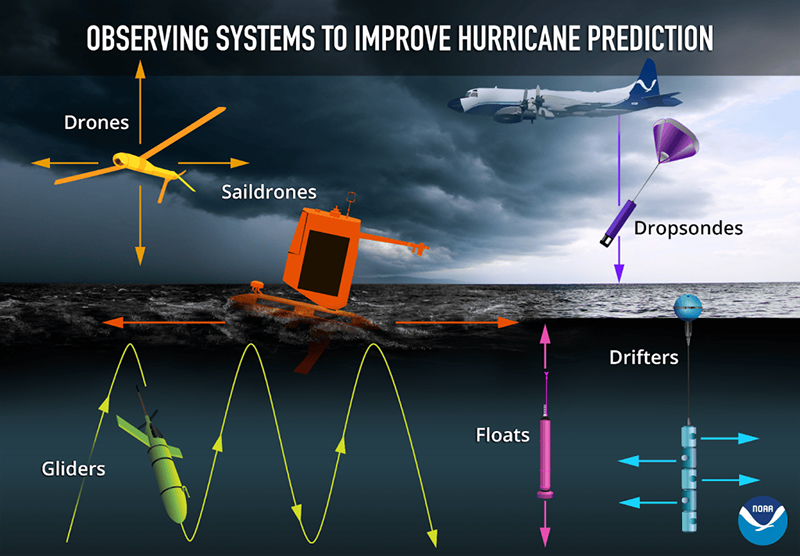
Underwater gliders fill a crucial gap in subsurface ocean observations, working alongside other tools to build a complete picture of hurricane-related ocean and atmospheric conditions.
Hurricane Gliders two-pager cover

Featured Resource

Hurricane Gliders

Explore how coordinated glider observations help improve hurricane intensity forecasts.

View the Two-Pager (PDF)
Comprehensive Observation Network

Gliders work alongside multiple observation platforms to provide complete ocean and atmospheric data for hurricane forecasting.

Underwater Gliders

Autonomous subsurface monitoring

Argo Floats

Global ocean profiling

XBTs

Expendable temperature probes

Moored Buoys

Fixed location monitoring

Satellites

Remote sensing coverage

HF Radars

Surface current mapping

Ocean Features Monitored by Gliders

Gliders provide continuous data on critical ocean features tied to hurricane intensity through sustained seasonal monitoring.

Loop Current

Warm water circulation in the Gulf of Mexico that can fuel rapid intensification.

Gulf Stream

Major Atlantic current system influencing storm tracks and intensity.

Mid-Atlantic Cold Pool

Cold water mass that can inhibit storm development and intensification.

Freshwater Barrier Layers

Salinity stratification affecting heat transfer and storm energy.

Atlantic Warm Pool

Large body of warm water providing energy for tropical cyclones.

Eddies and Rings

Circular ocean currents that can enhance or suppress hurricane intensity.

Hurricane Katrina Case Study

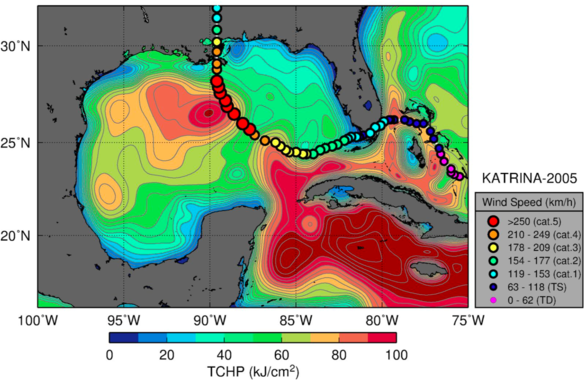
Hurricane Katrina crossed a Loop Current Eddy with high Tropical Cyclone Heat Potential, contributing to rapid intensification from Category 3 to Category 5 in just 12 hours.

This dramatic intensification demonstrates the critical importance of monitoring subsurface ocean conditions for accurate hurricane forecasting.

Credit: NOAA/AOML

What Gliders Measure

Autonomous underwater gliders collect comprehensive oceanographic data transmitted to the IOOS Glider Data Assembly Center for use in global ocean models and hurricane forecasts.
All gliders measure water column temperature, salinity, and pressure, and may also contain additional sensors that measure chlorophyll, dissolved oxygen, currents, etc. These data are transmitted to the IOOS Glider Data Assembly Center (GDAC), from which the temperature and salinity data are delivered to the global ocean circulation models to “course correct” the simulations. The ocean models feed the hurricane models, and studies show that a realistic ocean used in the hurricane models helps produce a more accurate hurricane intensity forecast.
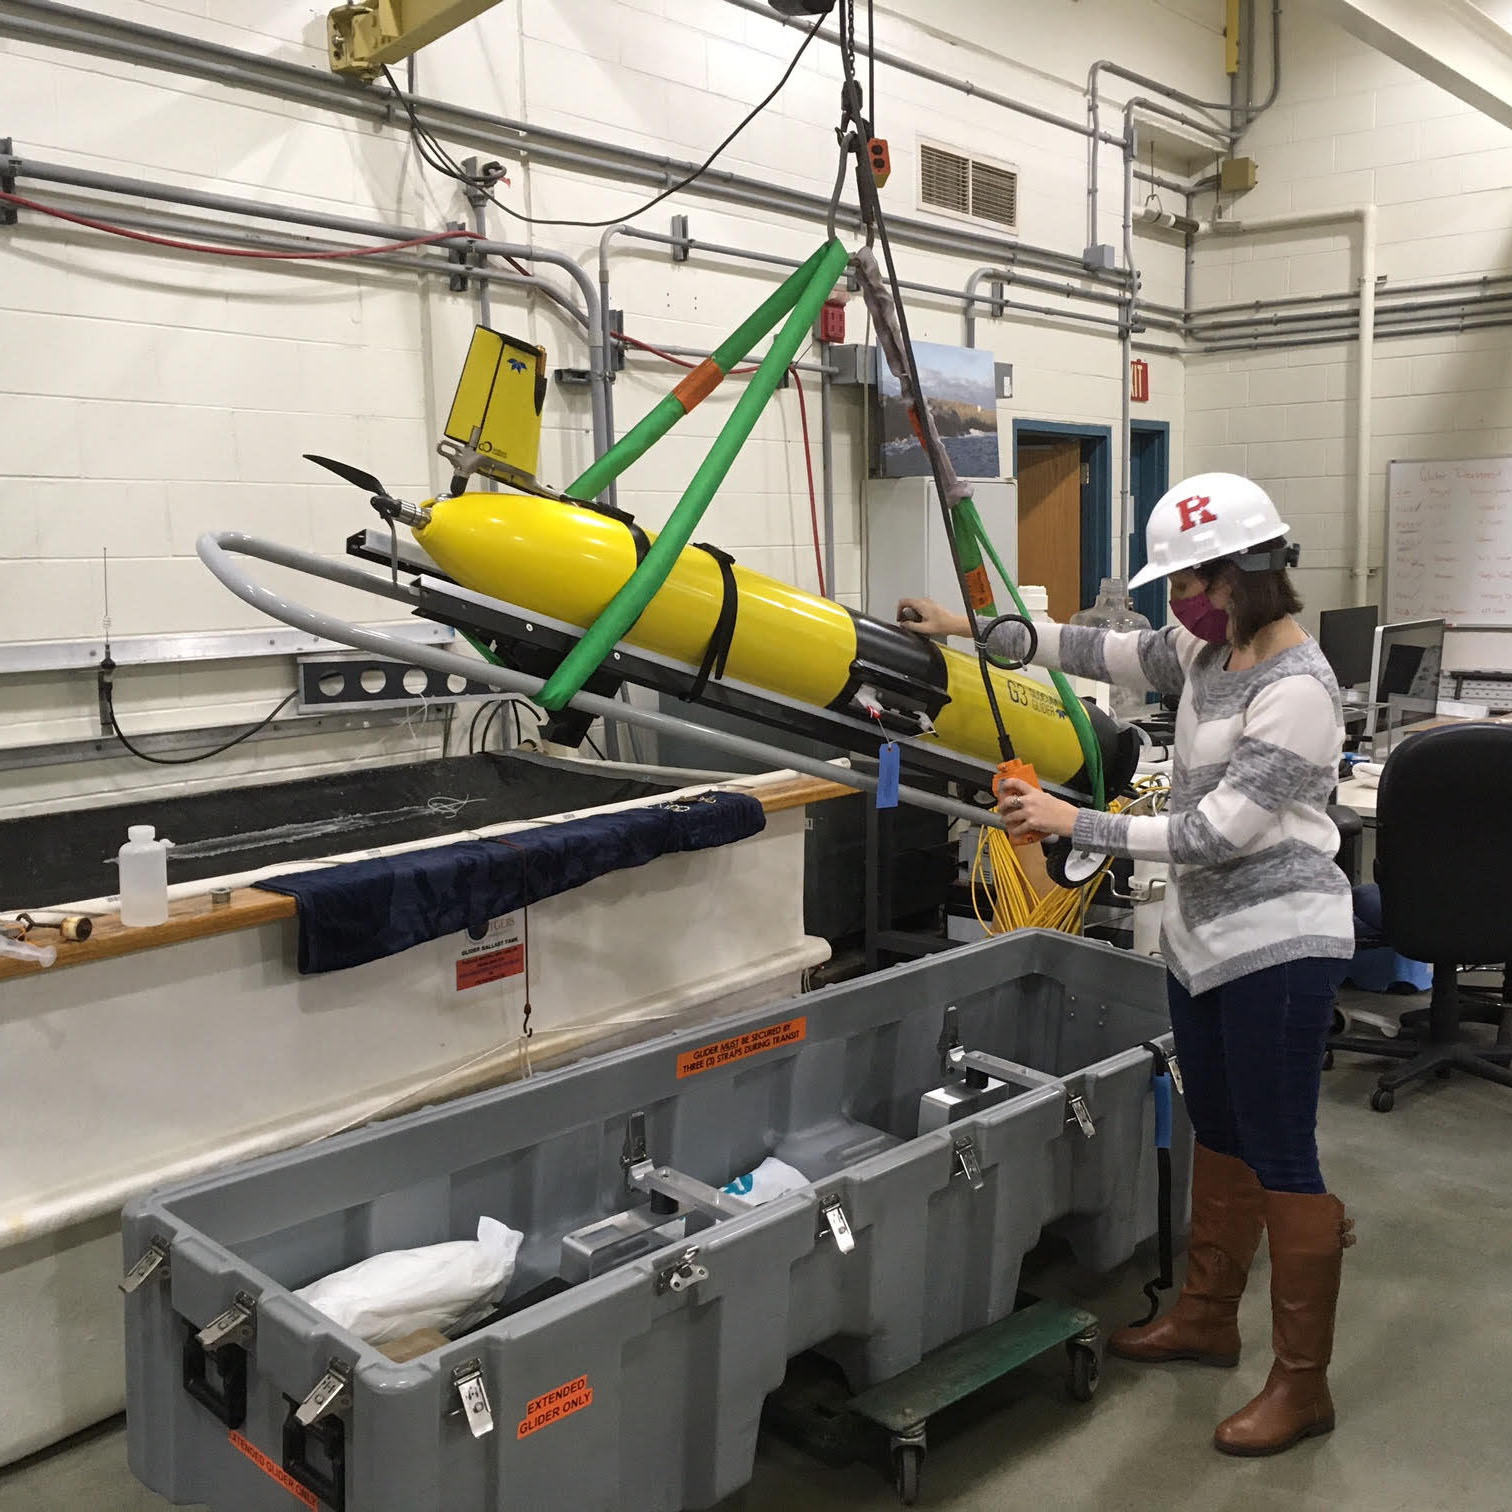
In 2014 the NOAA Atlantic Oceanographic and Meteorological Laboratory (AOML), along with partners including the Caribbean Coastal Ocean Observing System (CARICOOS) and Rutgers University, coordinated on the use of gliders to improve our understanding of the ocean’s role in hurricane intensity changes. This collaboration expanded to include additional partners operating gliders in the Caribbean Sea and Tropical Atlantic, Mid-Atlantic Bight, South-Atlantic Bight, and the Gulf of America (formerly Gulf of Mexico). In 2018 the IOOS Office began coordinating this community of multi-institutional, multi-regional glider operators on glider missions during the Atlantic hurricane season.
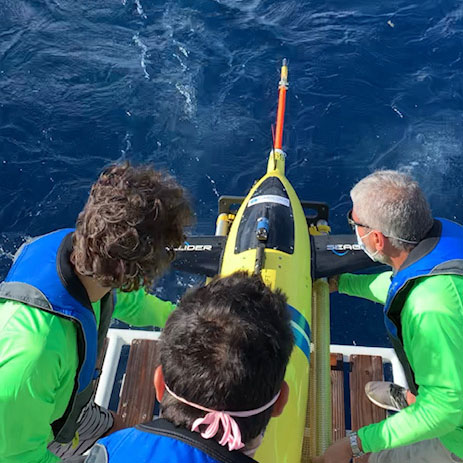
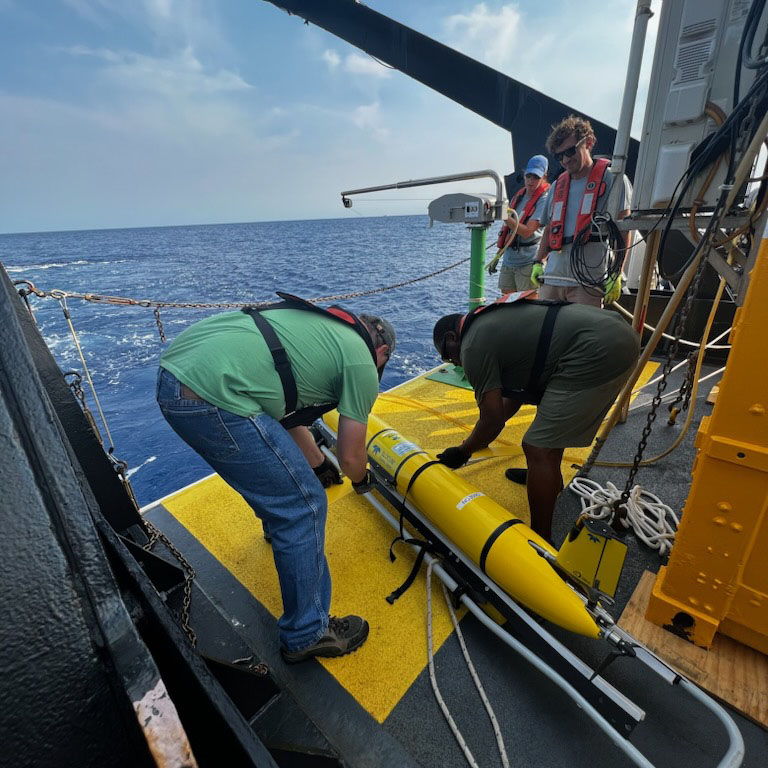
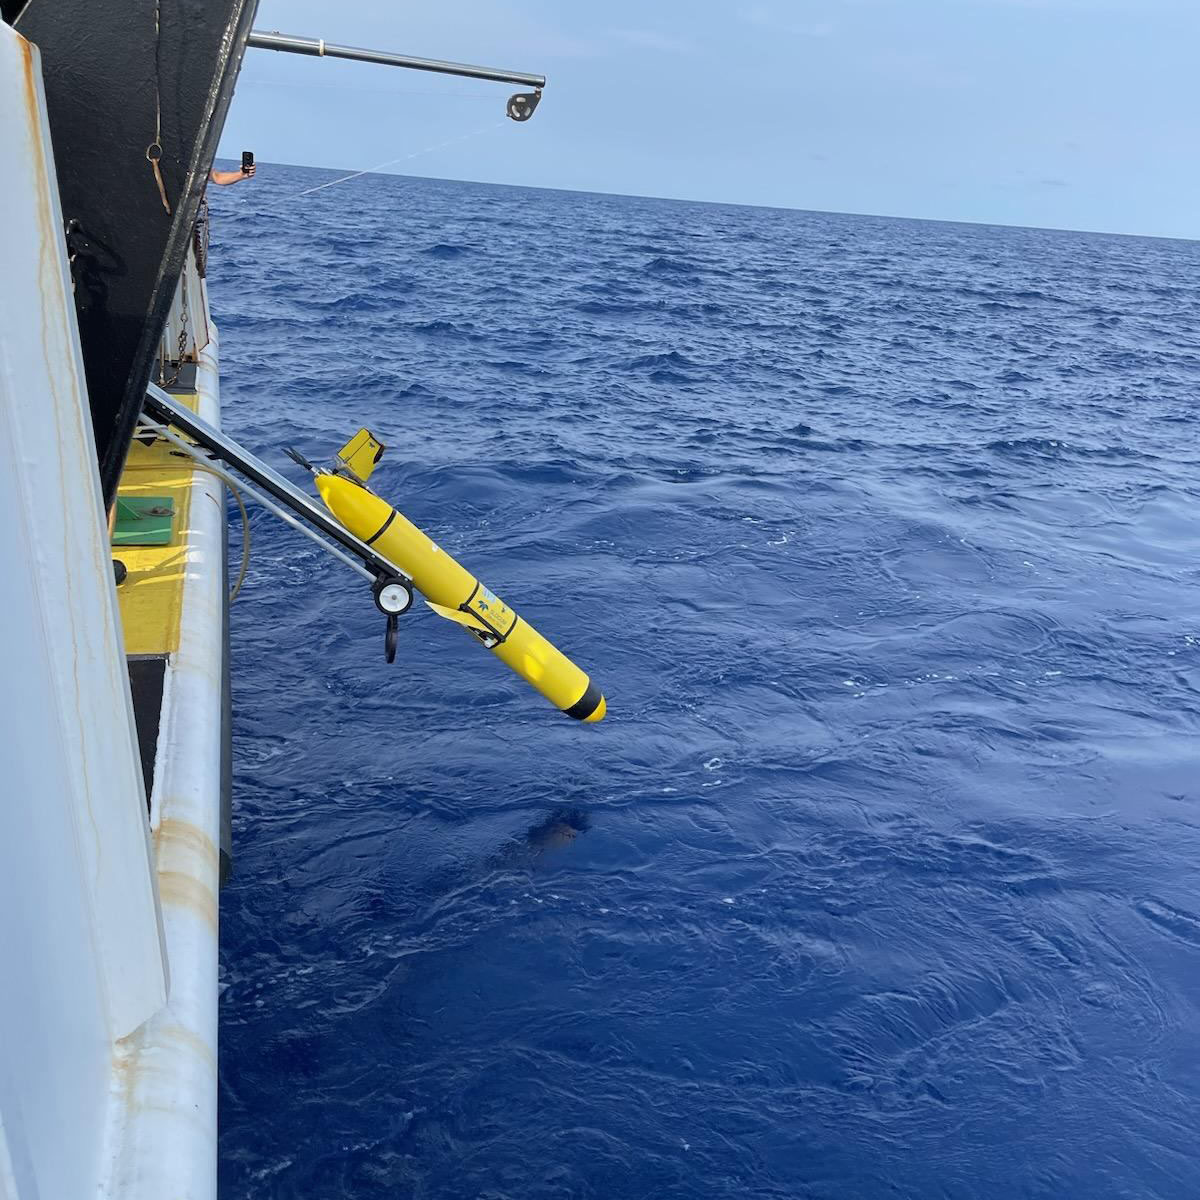
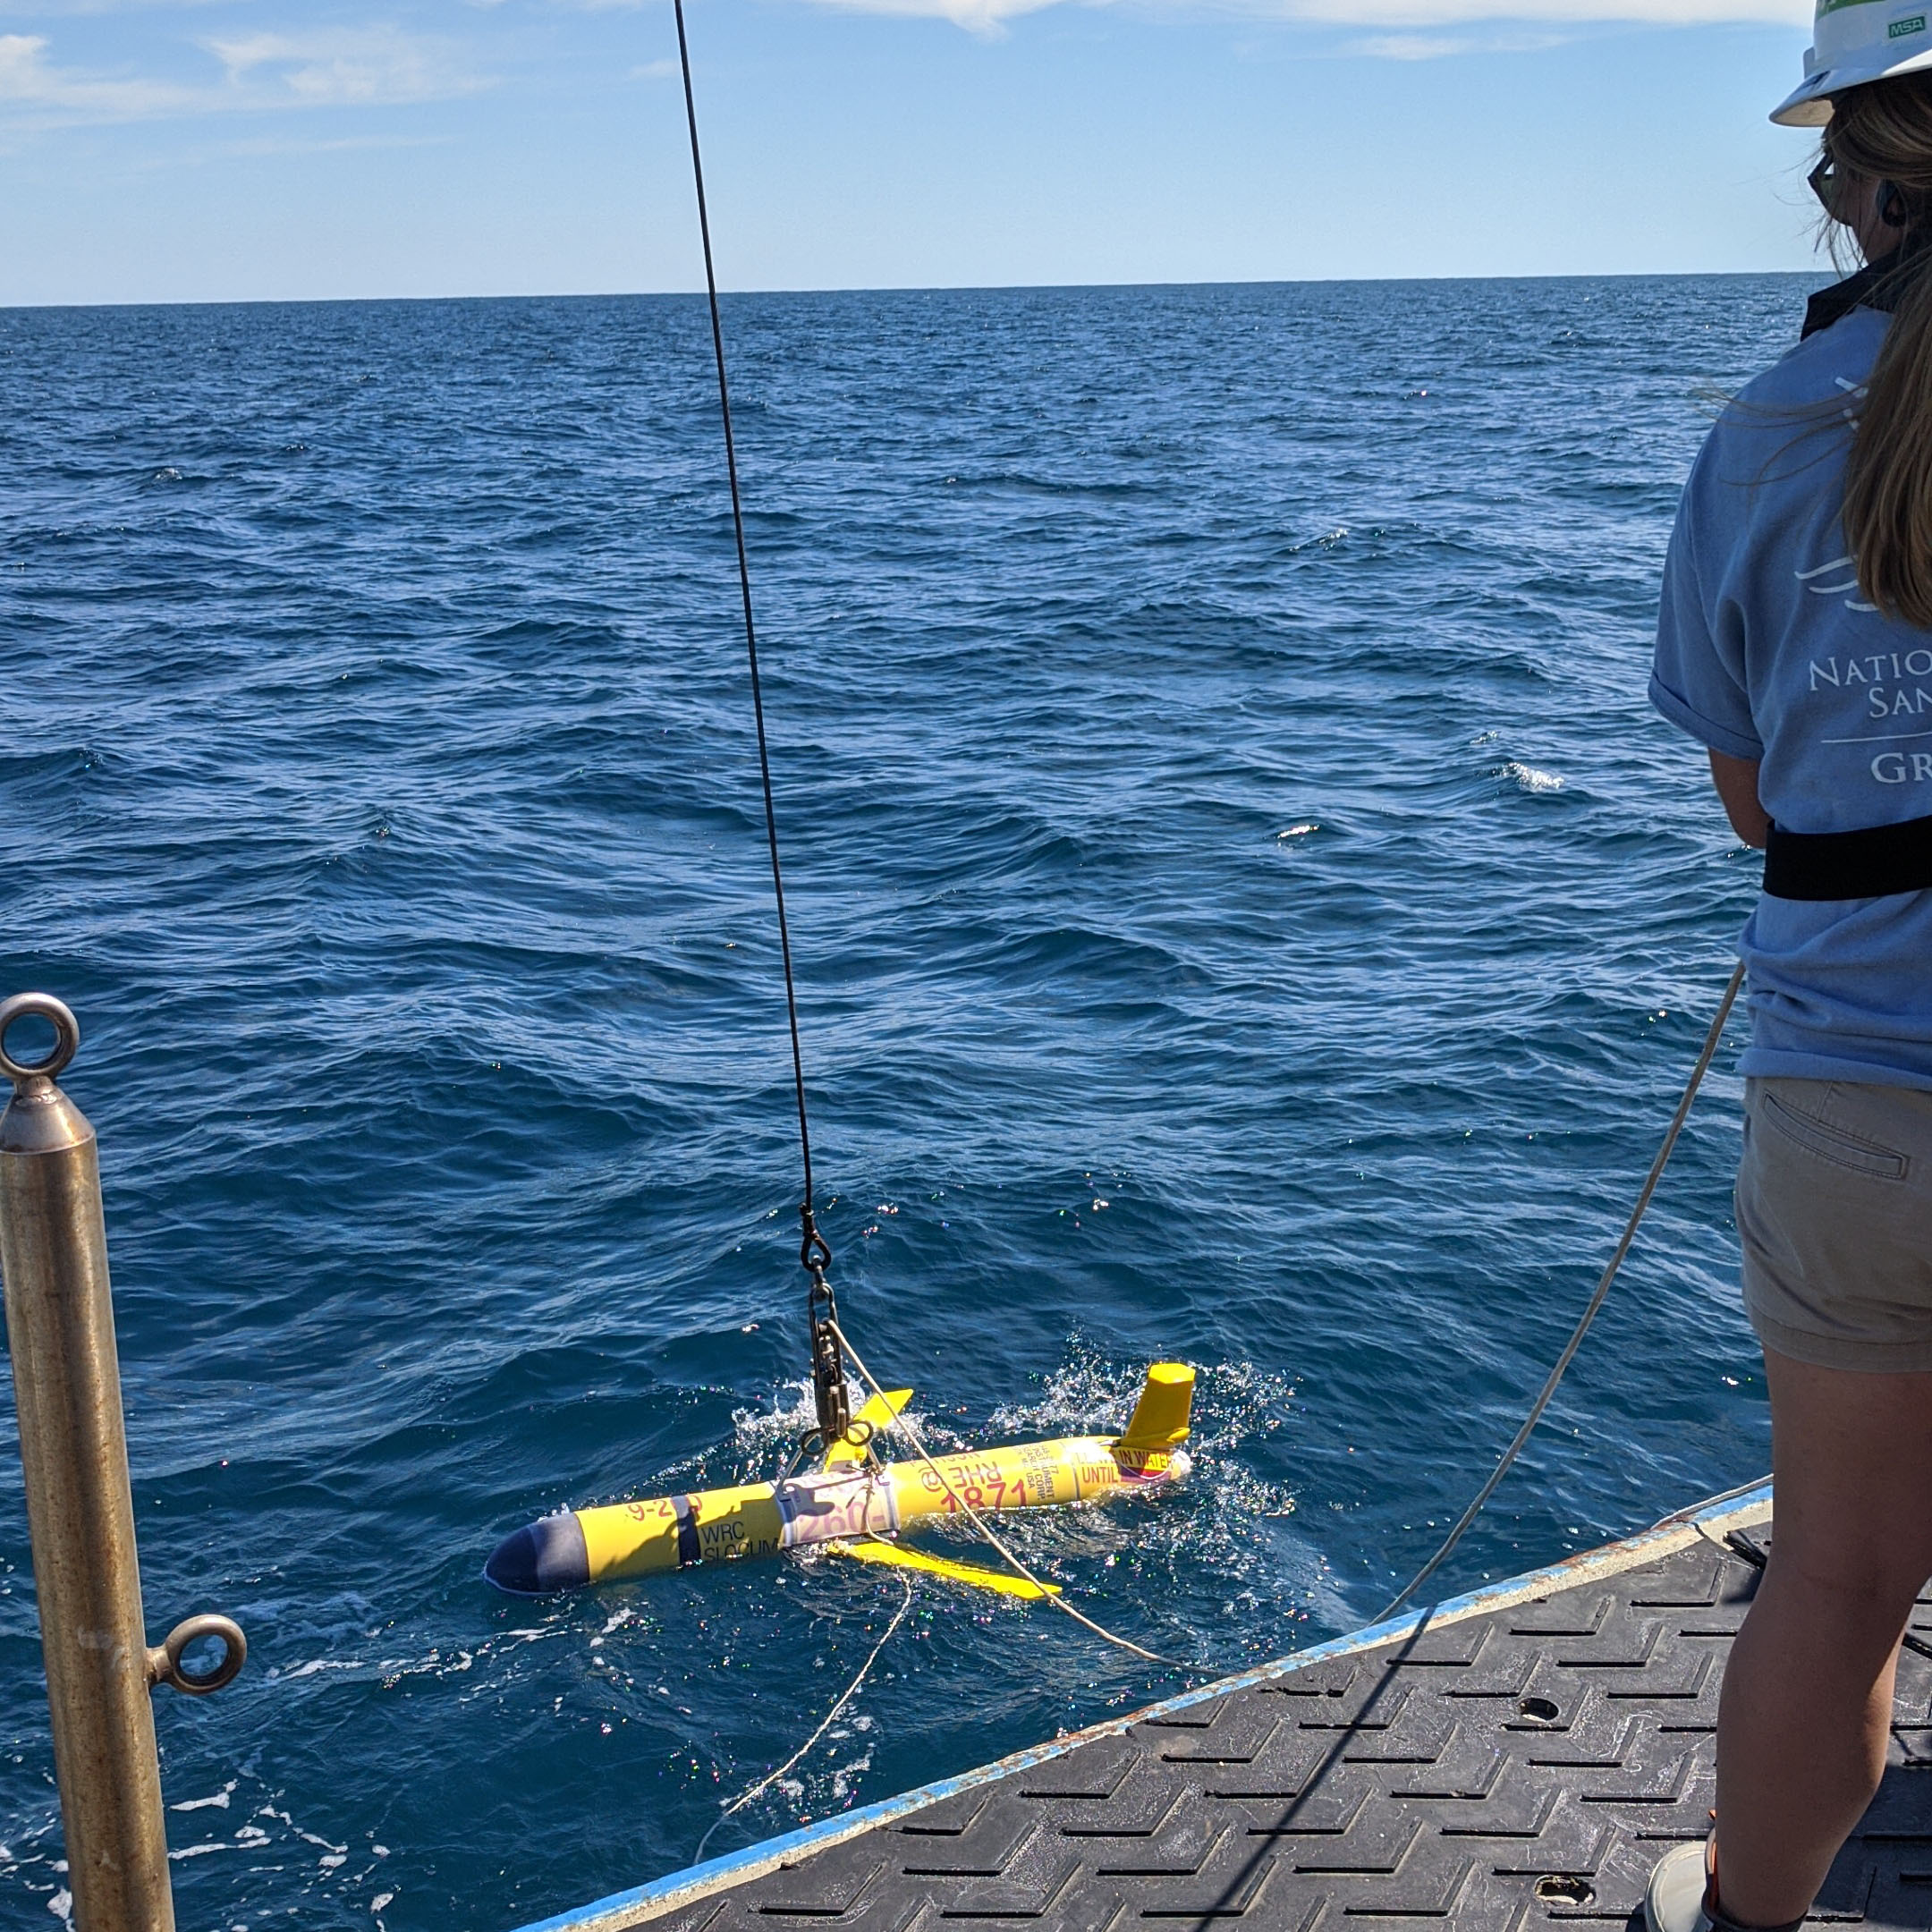
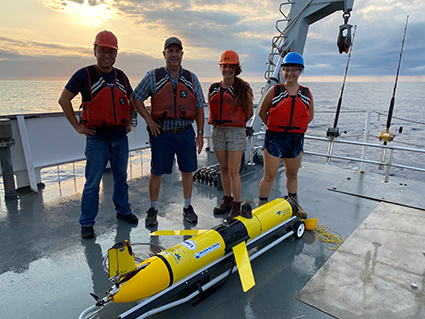
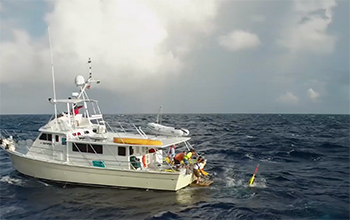
MARACOOS/VIMS partners on a glider deployment. Credit: VIMS

IOOS Glider Data Assembly Center (GDAC)

All glider data is transmitted in near real-time to the GDAC, where it is quality-controlled, standardized, and made freely available to researchers, forecasters, and the public.

Multi-Institutional Partnership

Hurricane glider missions are primarily led by IOOS Regional Associations, the U.S. Navy, and NOAA Research groups, working in close coordination to maximize data coverage. These efforts directly support NOAA Global Ocean Monitoring and Observing’s Extreme Events Program, enhancing our nation’s ability to forecast and respond to hurricanes.

By the Numbers

These metrics represent the Atlantic and Pacific hurricane seasons from 2018-2025:

38 of 49 (78%)

Tropical cyclones measured

12 of 13 (92%)

Major hurricanes aimed at U.S. waters

603

Glider deployments

27,701

Glider days at sea

936,168

Glider profiles

27

Partner institutions

References & Further Reading

Emanuel, K. (2005)

Increasing destructiveness of tropical cyclones over the past 30 years. Nature 436, 686–688.

NOAA NCEI

Billion-Dollar Weather and Climate Disasters. Comprehensive database of major weather events and their economic impacts.

Planned 2026 Hurricane Glider Missions

NOAA predicts a below-average Atlantic hurricane season and an above-average hurricane season for the Eastern Pacific and Central Pacific basins. The hurricane glider coordination group, composed of numerous organizations across NOAA, U.S. Navy, and academia, expects to deploy approximately 26 Atlantic and 6 Pacific hurricane mission-specific gliders, in hurricane-prone coastal regions of the U.S. Approximately 50 gliders deployed for other, non-hurricane missions will also be leveraged. The data from these gliders will be used in NOAA’s models to help improve the accuracy of hurricane intensity forecasts for the 2026 hurricane season
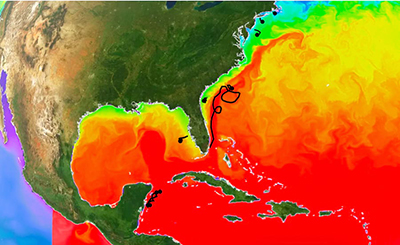
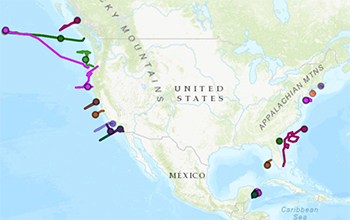
Planned 2026 Atlantic basin glider tracks identified by the hurricane glider partners, including the U.S. Navy, IOOS Regional Associations, NOAA/AOML, and other NOAA partners.

Storm View

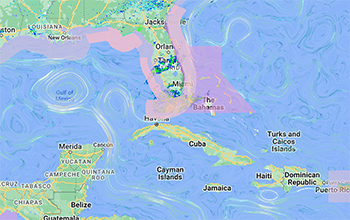
This map view shows important data for tracking storms and assessing coastal risks. Water temperature, wave height, and winds are loaded, as well as tropical cyclone outlook and active storms. Gliders provide data at their location. Click the “Explore Now” button for a real-time map view in the IOOS Model Viewer.

Historical storm and glider tracks, filtered by notable storm or by Hurricane Season, are also available in the Storm Archive.

Model-Observation Comparisons

A team led by the Mid-Atlantic Regional Association Coastal Ocean Observing System (MARACOOS) at Rutgers University conducts qualitative comparisons between glider and Argo profile observations and global ocean model output to identify regions where models may benefit from additional observations or improved representation of ocean processes. Models included in the comparison are the NOAA Real-Time Ocean Forecast System (RTOFS), the U.S. Navy Earth System Prediction Capability (ESPC), the European Copernicus Marine Environmental Monitoring Service (CMEMS), and the East Coast Community Ocean Forecast System (ECCOFS). These analyses consistently show that modeled subsurface water mass properties in the upper 400 m of the water column improve in regions where glider and Argo profile observations are assimilated, while areas lacking subsurface observations tend to exhibit larger model biases. Results are communicated with the Office of Modeling and Development (OMD) within the NWS National Centers for Environmental Prediction (NCEP), and have directly informed improvements to the RTOFS model.

How to Access

Rutgers University has developed tools to explore these model-observation comparisons of ocean models and glider, Argo, and Fishing Vessel Observing Network (FVON) data. The IOOS Model Comparisons Archive Explorer features a quick-look panel that automatically loads the most recent available map for a selected region. Users can flip through regions, variables, depths, and model comparisons. The viewer also plots profiles from ocean models and in-situ observations for further analysis. An adaptive sampling guidance feature compares ocean heat content, sea surface salinity, and current speed from models in the Atlantic basin to help guide glider field operations. The Ocean Model Plotter allows along-track cross-section comparisons of observations and models.

Rutgers Archive Explorer comparing RTOFS and ESPC surface temperatures in the Caribbean.
Rutgers IOOS Model Comparisons Archive Explorer showing surface temperature comparisons of the NOAA Real-Time Ocean Forecast System (RTOFS) and Navy Earth System Prediction Capability (ESPC) models in the Caribbean.

Use Cases

Glider Data Reduces Model Biases Ahead of Hurricane Ernesto (2024)

A Bermuda Institute of Ocean Sciences (BIOS) glider, “Jack,” was deployed on August 12 shortly before Hurricane Ernesto approached the region. Prior to the deployment, RTOFS exhibited a warm and fresh bias relative to observed conditions. After the glider profiles were assimilated, the model showed improved agreement with observed temperature and salinity and produced a more accurate estimate of ocean heat content. Quantitative analysis showed a substantial reduction in bias and root mean square error (RMSE) in the upper 400 m of the water column following assimilation of the glider observations. Temperature bias decreased by approximately 110% and RMSE decreased by approximately 52%. Similar improvements were observed for salinity, with bias reduced by approximately 55% and RMSE reduced by approximately 64%. These results demonstrate the operational value of glider observations for improving the representation of upper-ocean conditions in ocean forecast models that support TC prediction.

Temperature and salinity profiles comparing glider Jack observations with RTOFS production and parallel models before and after assimilation during Hurricane Ernesto.Ocean heat content estimates from RTOFS production and parallel models converge after assimilation of glider Jack observations.
Qualitative comparisons of glider temperature and salinity observations and the global ocean models, NOAA RTOFS (production) and NOAA RTOFS Parallel (development version run in parallel), which was a development version of RTOFS. Before assimilation, the models are biased warm and fresh compared to the glider (upper left). After assimilation, the models improve their estimates of temperature and salinity which is more representative of the glider profile (upper right). The model’s production and parallel versions show a distinct convergence in ocean heat content (bottom). Source: Rutgers University

Improvements to NOAA’s Real-Time Ocean Forecast System (RTOFS) ahead of Hurricane Melissa (2025)

In July 2025, RTOFS was upgraded to version 2.5, which included the application of a climatological constraint to the assimilation of sea surface height. This change addressed a subsurface negative salinity bias and cold temperature bias in the Subtropical Underwater in the Caribbean that was identified through the IOOS model-data comparisons. Following this upgrade, the ocean forecast ahead of Hurricane Melissa showed improved agreement with observed conditions in the Caribbean, despite the absence of gliders in the region at that time, although model temperatures at depth remained slightly cooler than observations.

Caribbean temperature and salinity profile comparisons showing improved representation of SubTropical UnderWater after the RTOFS 2.5 upgrade.
Improved representation of the SubTropical UnderWater in the Caribbean after the implementation of RTOFS 2.5 Source: Rutgers University.

NOAA - U.S. Navy Glider Collaboration

Strategic Partnership

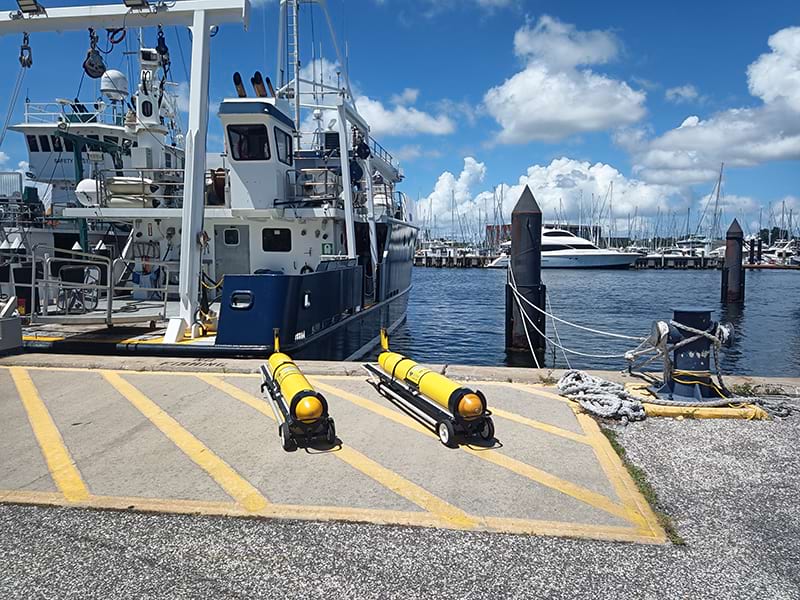
Since 2018, the U.S. Navy has provided Littoral Battlespace Sensing gliders for NOAA hurricane monitoring missions. This collaboration represents a critical force multiplier for hurricane observation efforts.

25%

of Atlantic hurricane season glider observations
Coordination is supported by NOAA’s Office of Marine and Aviation Operations (OMAO), ensuring seamless integration between Navy and civilian glider operations.
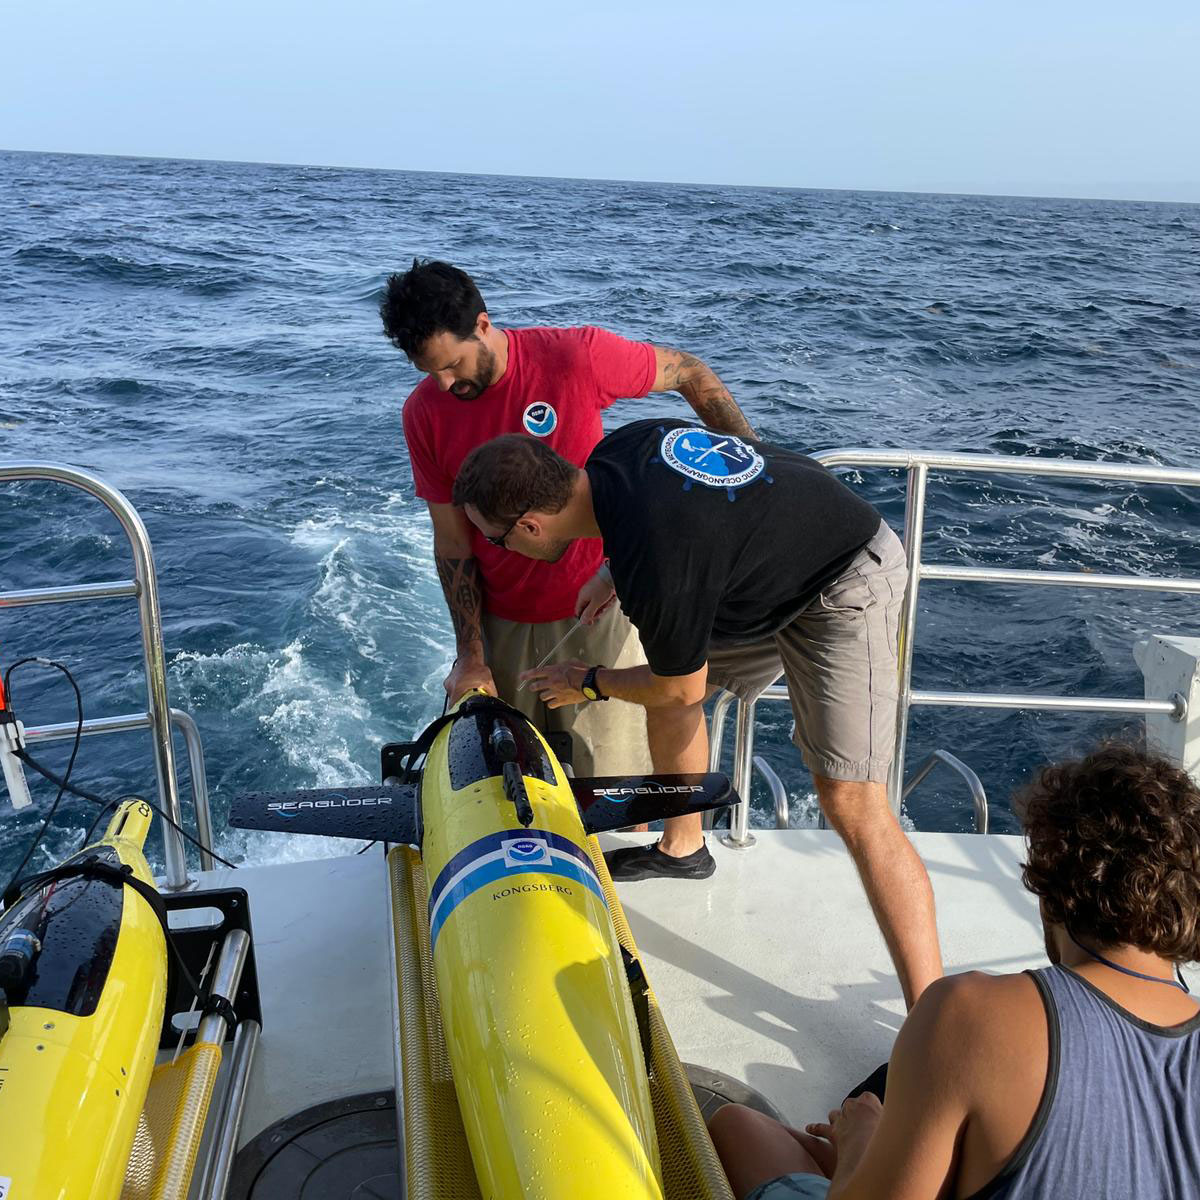
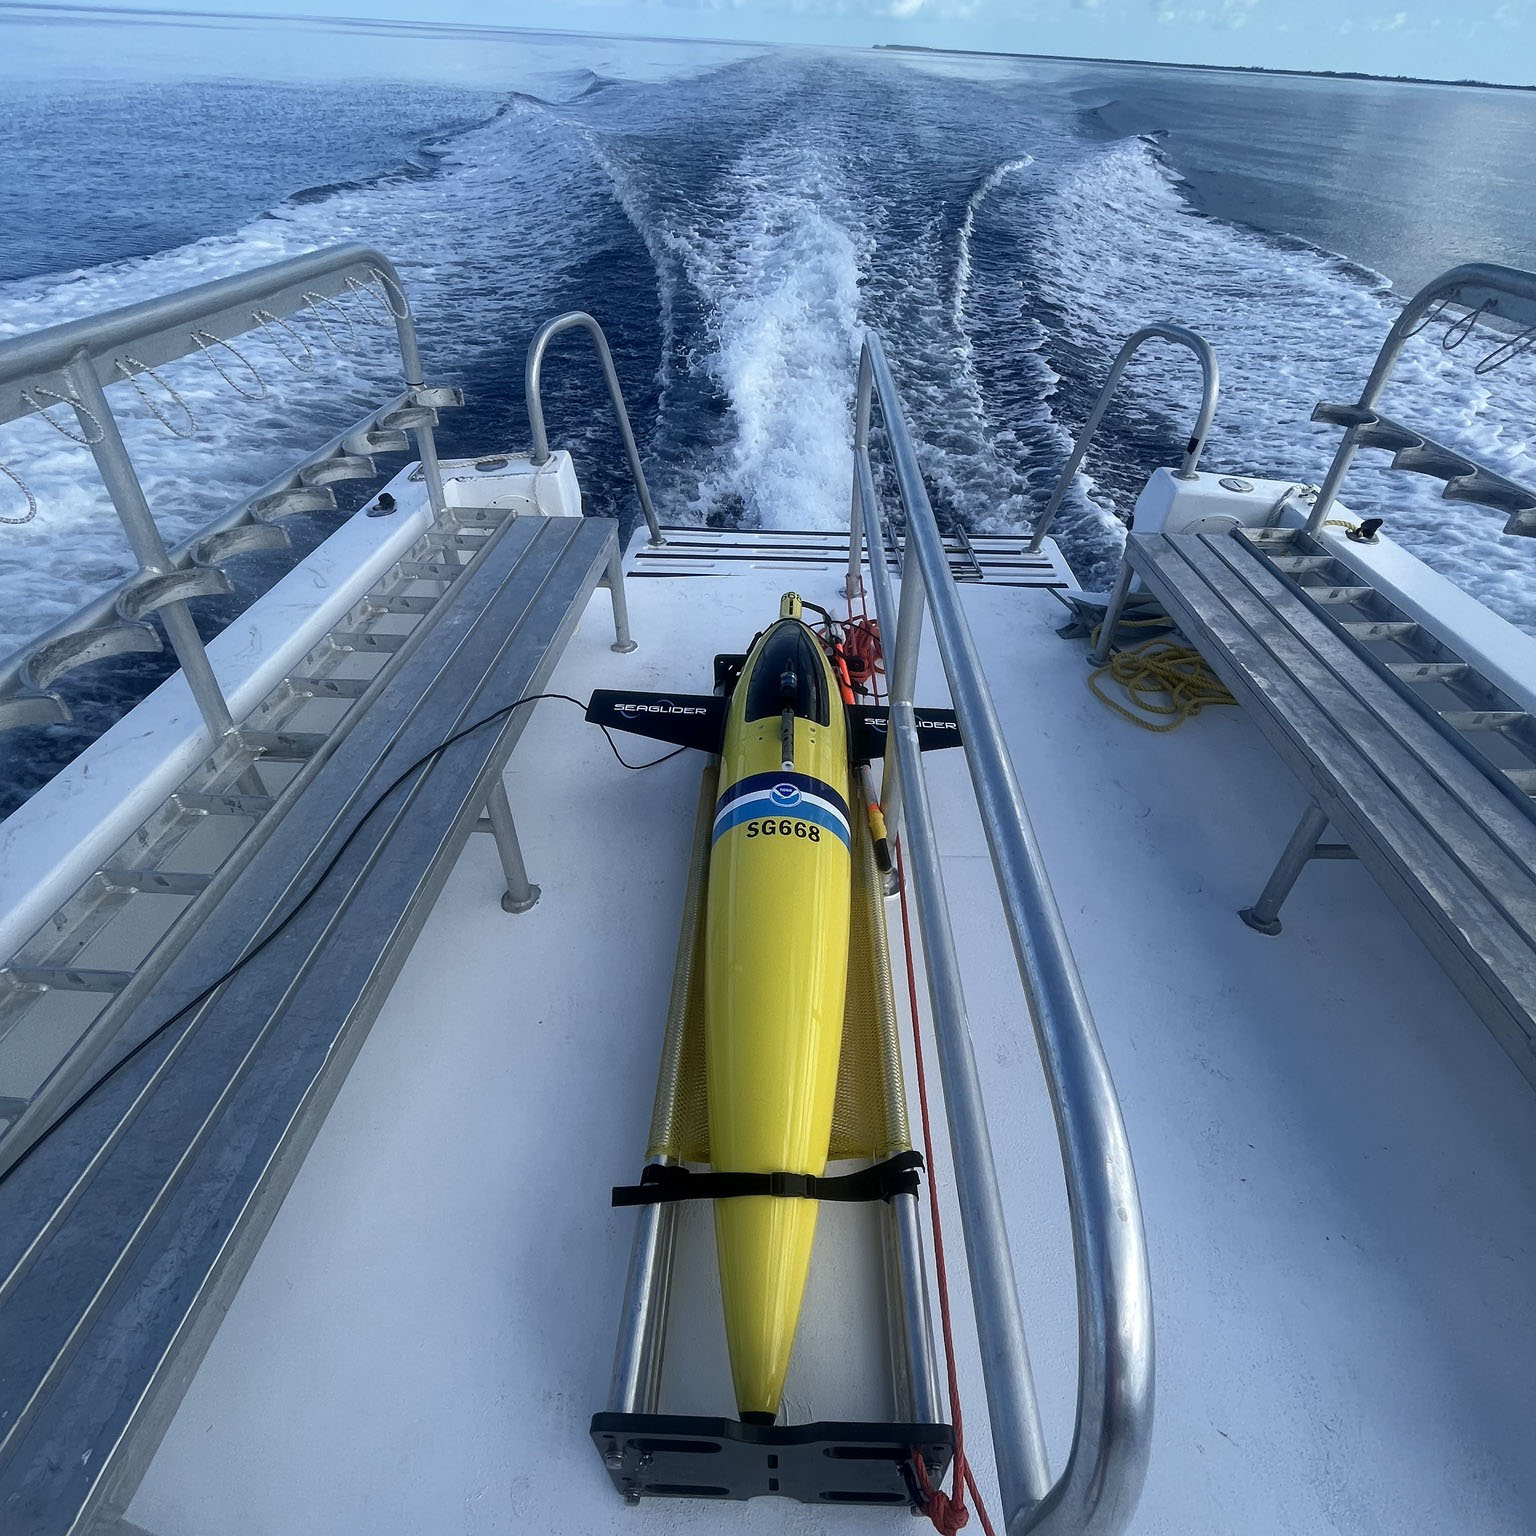
Navy gliders ready for deployment. Credit: USF
Advanced Platforms

Navy Littoral Battlespace Sensing gliders provide cutting-edge technology for subsurface monitoring

Operational Integration

Seamless coordination between military and civilian operations maximizes coverage

Data Sharing

All observations shared through IOOS GDAC for use in hurricane forecasting models
NOAA NHC: Official Forecasts
NOAA AOML: Glider Research | Map
CARICOOS: Hurricane Info
SECOORA: Hurricane info | Map
GCOOS: Hurricane info | Map
MARACOOS: Hurricane Info | Map

Media Library

News / Press Releases

Videos

Images

Click on the thumbnail to view a full-size version.

Search the Site